Stage 2: Data Sources
In the Data Sources stage you configure the connections used by dataloggers and controllers to send monitoring data to the Amperecloud platform.
Overview
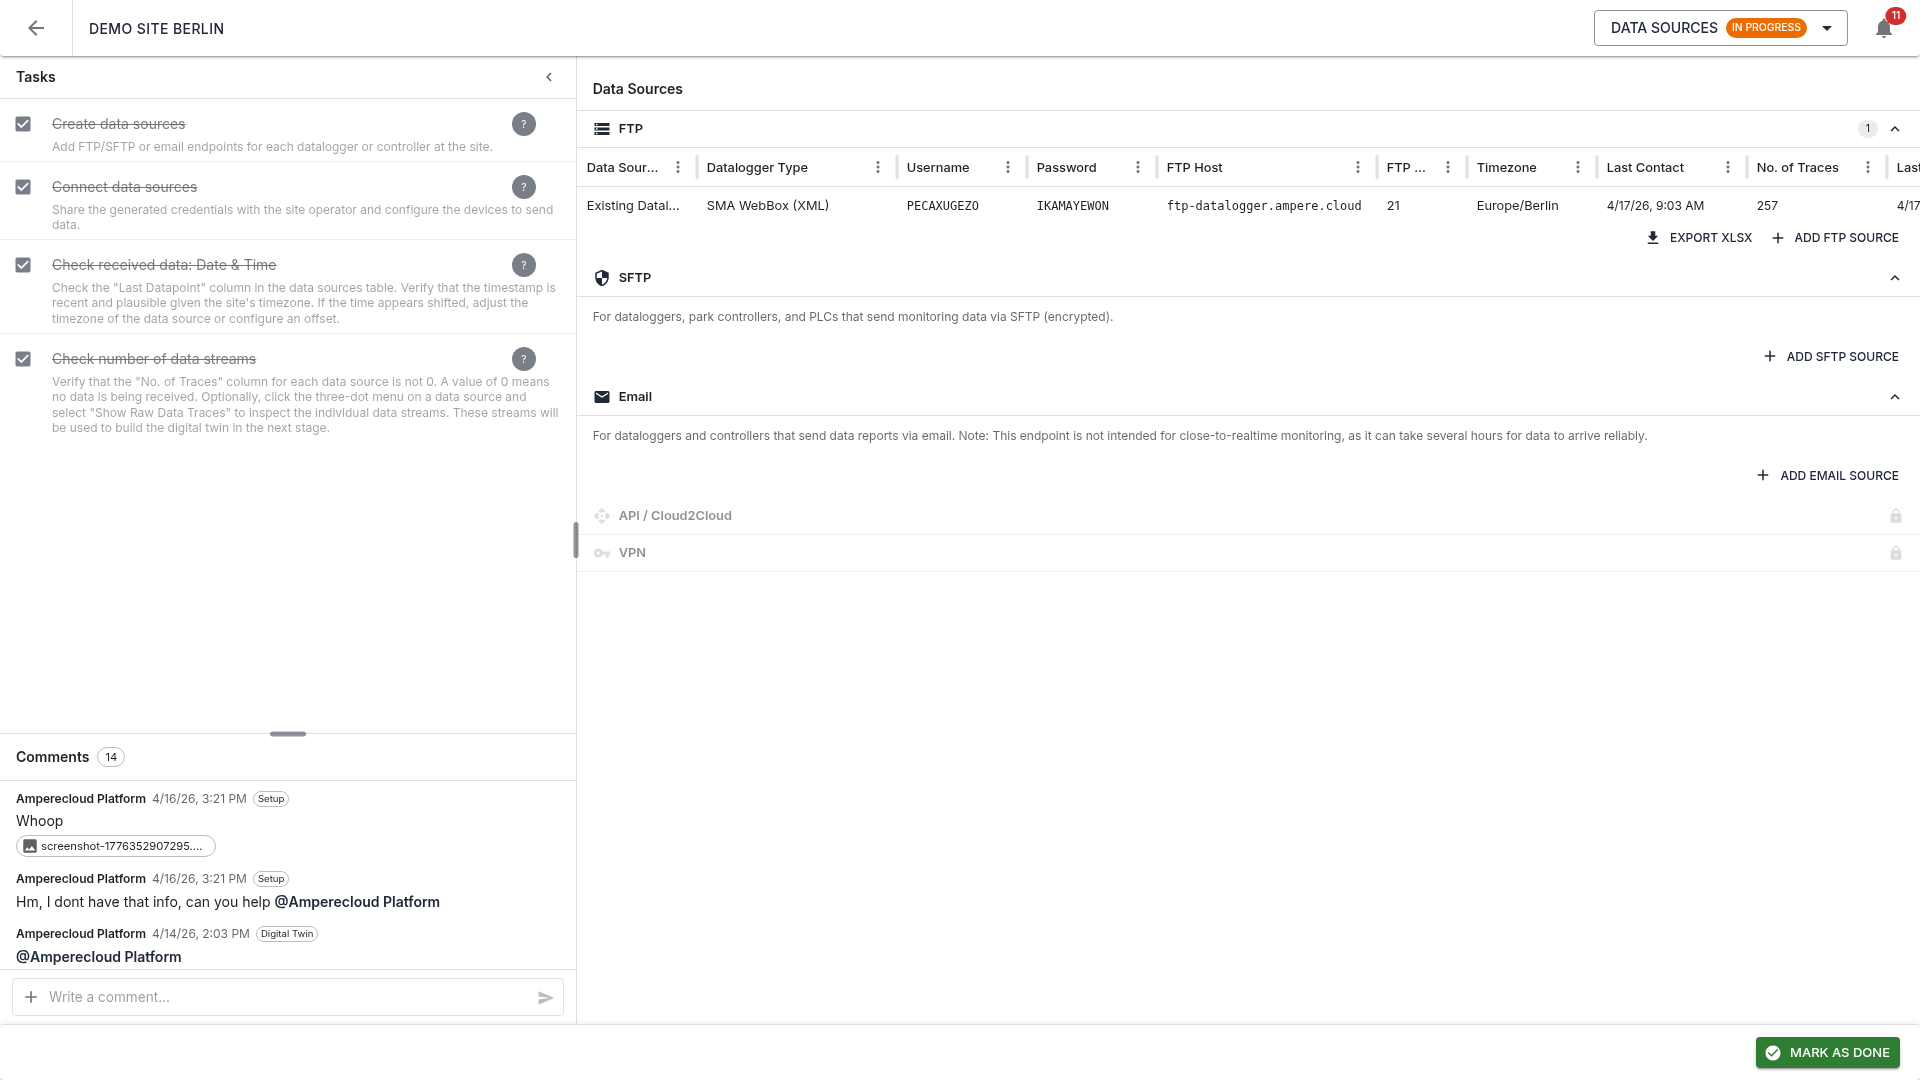
The view is split in two:
- Left: tasks (4 items) and comments
- Right: data sources grouped by connection type (FTP, SFTP, Email, API, VPN)
Connection types
FTP
For dataloggers, park controllers, and PLCs sending monitoring data via FTP. On creation an FTP account is generated automatically. The credentials are shown in the table:
- Source name: free-text name
- Datalogger type: e.g. SolarLog, Huawei SmartLogger, SMA WebBox
- Username / password: auto-generated
- FTP host:
ftp-datalogger.ampere.cloud - FTP port:
21 - Timezone: configured timezone of the datalogger
- Last contact: last time data was received
SFTP
Like FTP, but encrypted: - SFTP host:
sftp-datalogger.ampere.cloud - SFTP port:
22
For dataloggers that send reports by email. A unique email address is generated automatically.
Note: email endpoints are not suited for real-time monitoring — data can take hours to arrive.
API / Cloud2Cloud and VPN
Reserved for future use, currently unavailable.
Create a data source
Single
Click “Add FTP source” (or SFTP / Email). A dialog opens in Single mode:
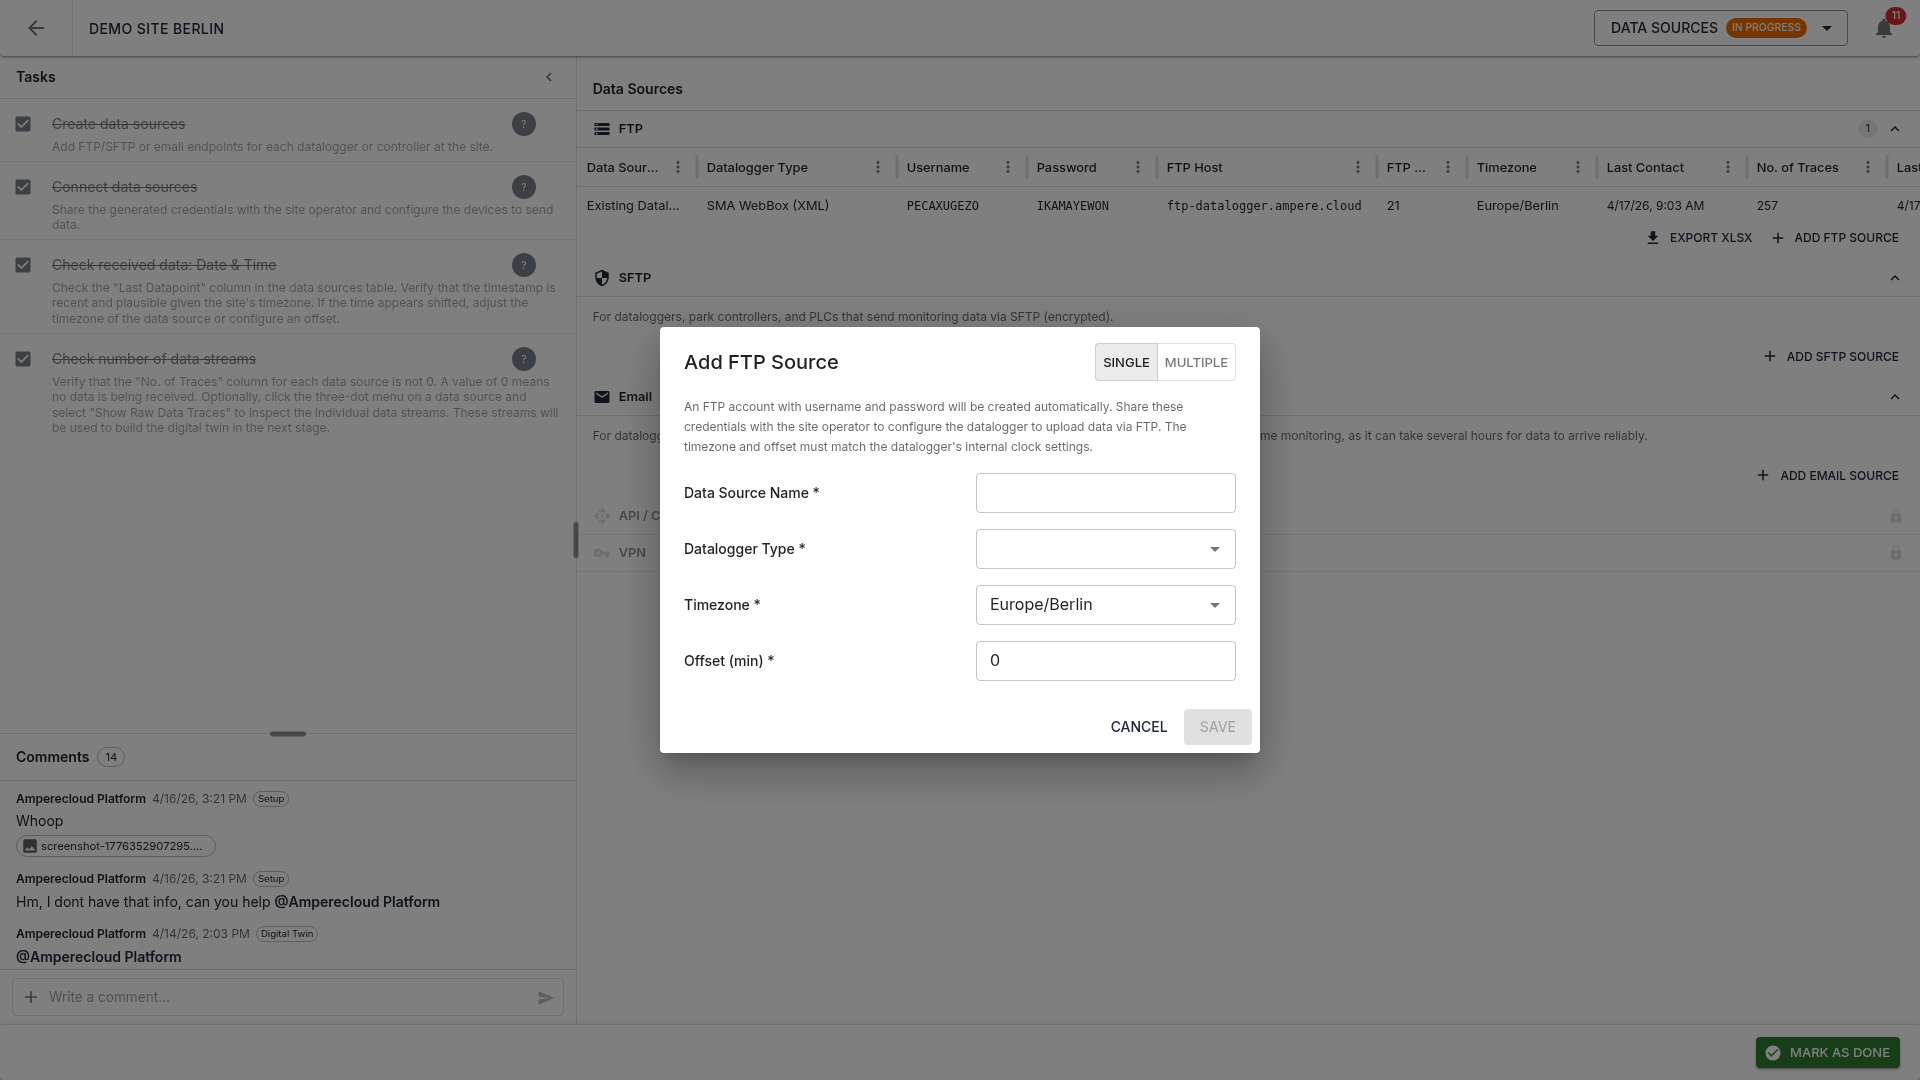
Fields:
- Source name * (e.g. “INV South 01”)
- Datalogger type *: pick from dropdown
- Timezone *: must match the datalogger’s internal clock
- Offset (min) *: time offset (default 0)
Click “Save” to create the source; credentials appear in the table.
Multiple (batch)
Switch to “Multiple” in the dialog:
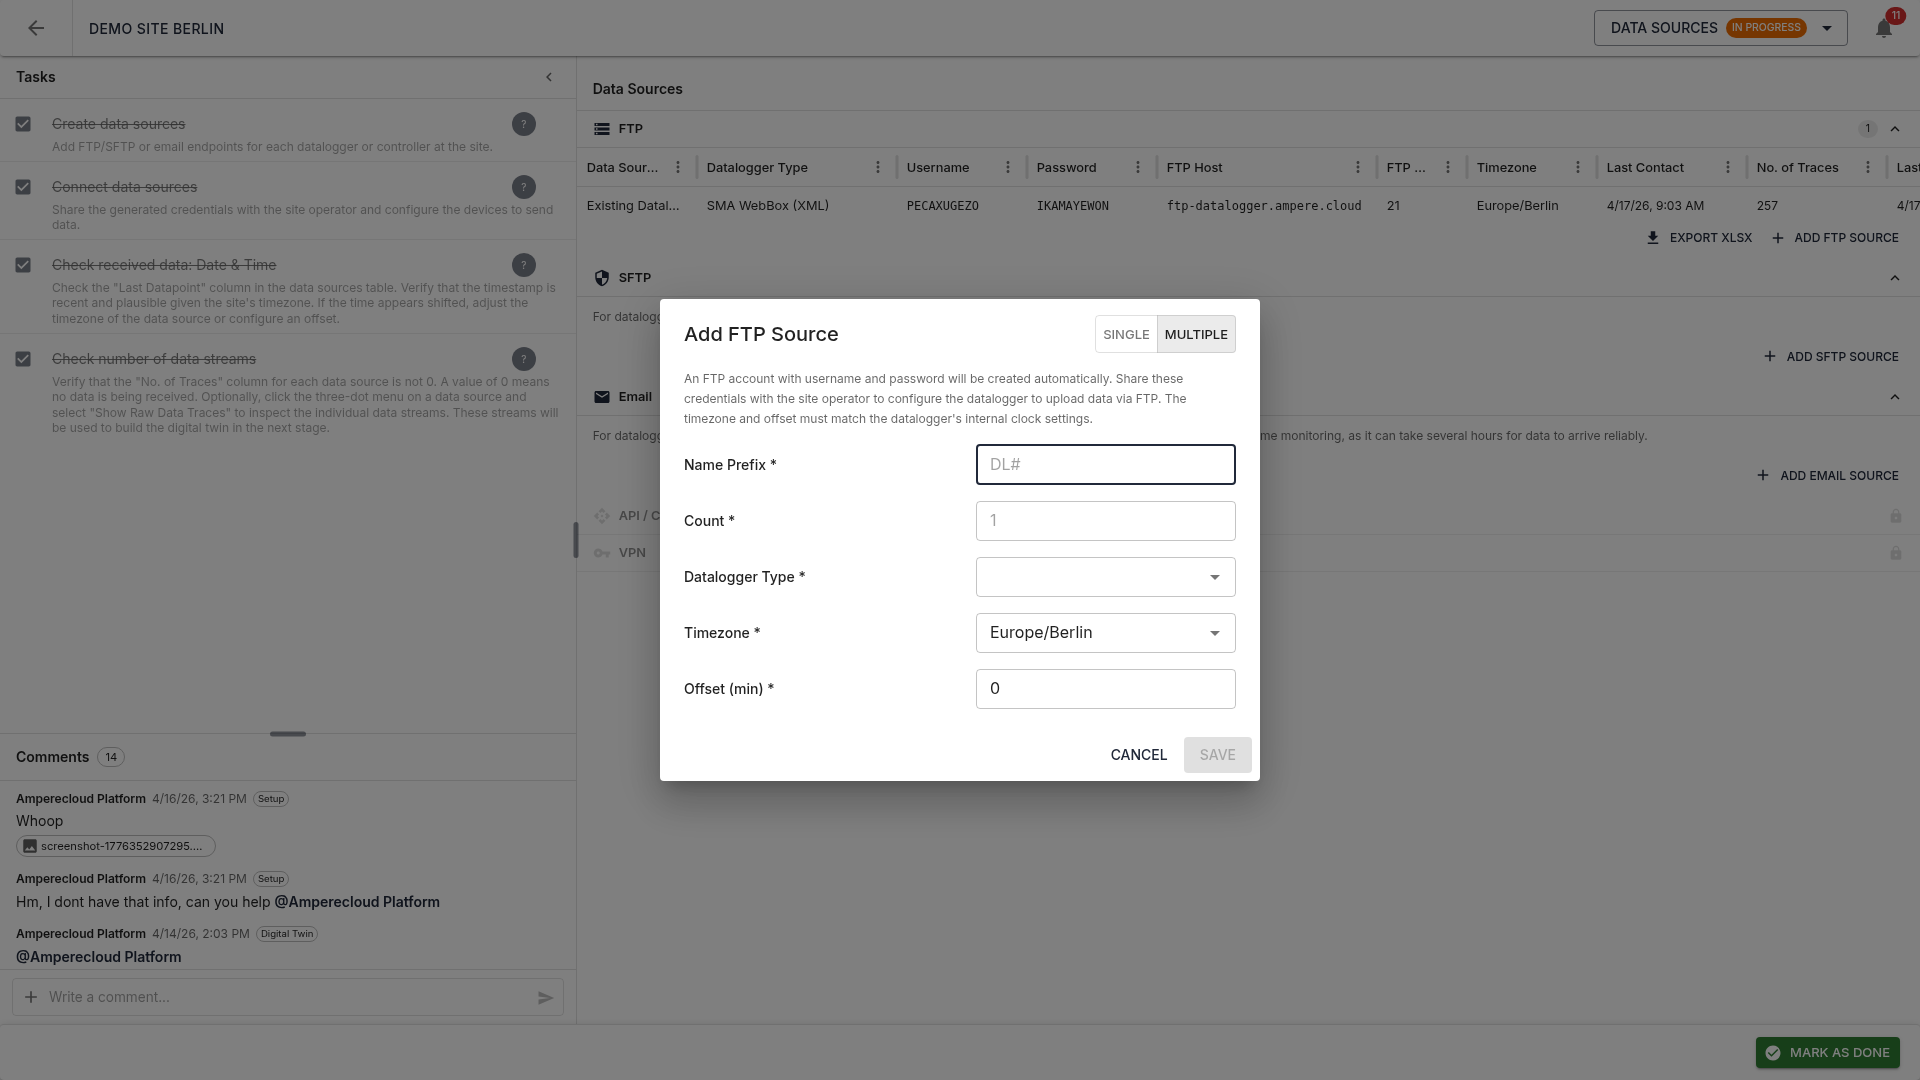
- Name prefix * (e.g. “DL#”)
- Count * (1–99)
Sources are named DL#-00, DL#-01,
DL#-02, …. Datalogger type, timezone, and offset apply to
all.
For more than 5 sources a progress bar is shown. If any fail, an error report with the affected entries is shown at the end.
Distribute credentials
The generated credentials need to be shared with the site operator or hardware installer so they can configure the dataloggers accordingly.
XLSX export
Use “Export XLSX” to download all credentials of a connection type as an Excel file. The file includes host, port, username, password, and timezone. A bulk export of all credentials across selected sites is also available in the site overview.
Verify data reception
Once data arrives, the following columns update:
- Last contact: check that the timestamp is recent and plausible
- Trace count: number of reading streams — 0 means no data

The received data traces will be used automatically in the next stage (Scan) to build the digital twin.
Show raw traces
Via the three-dot menu (⋮) at the end of each row, select “Show raw traces”. The left sidebar (tasks / comments) is collapsed automatically to maximize space for the panel:
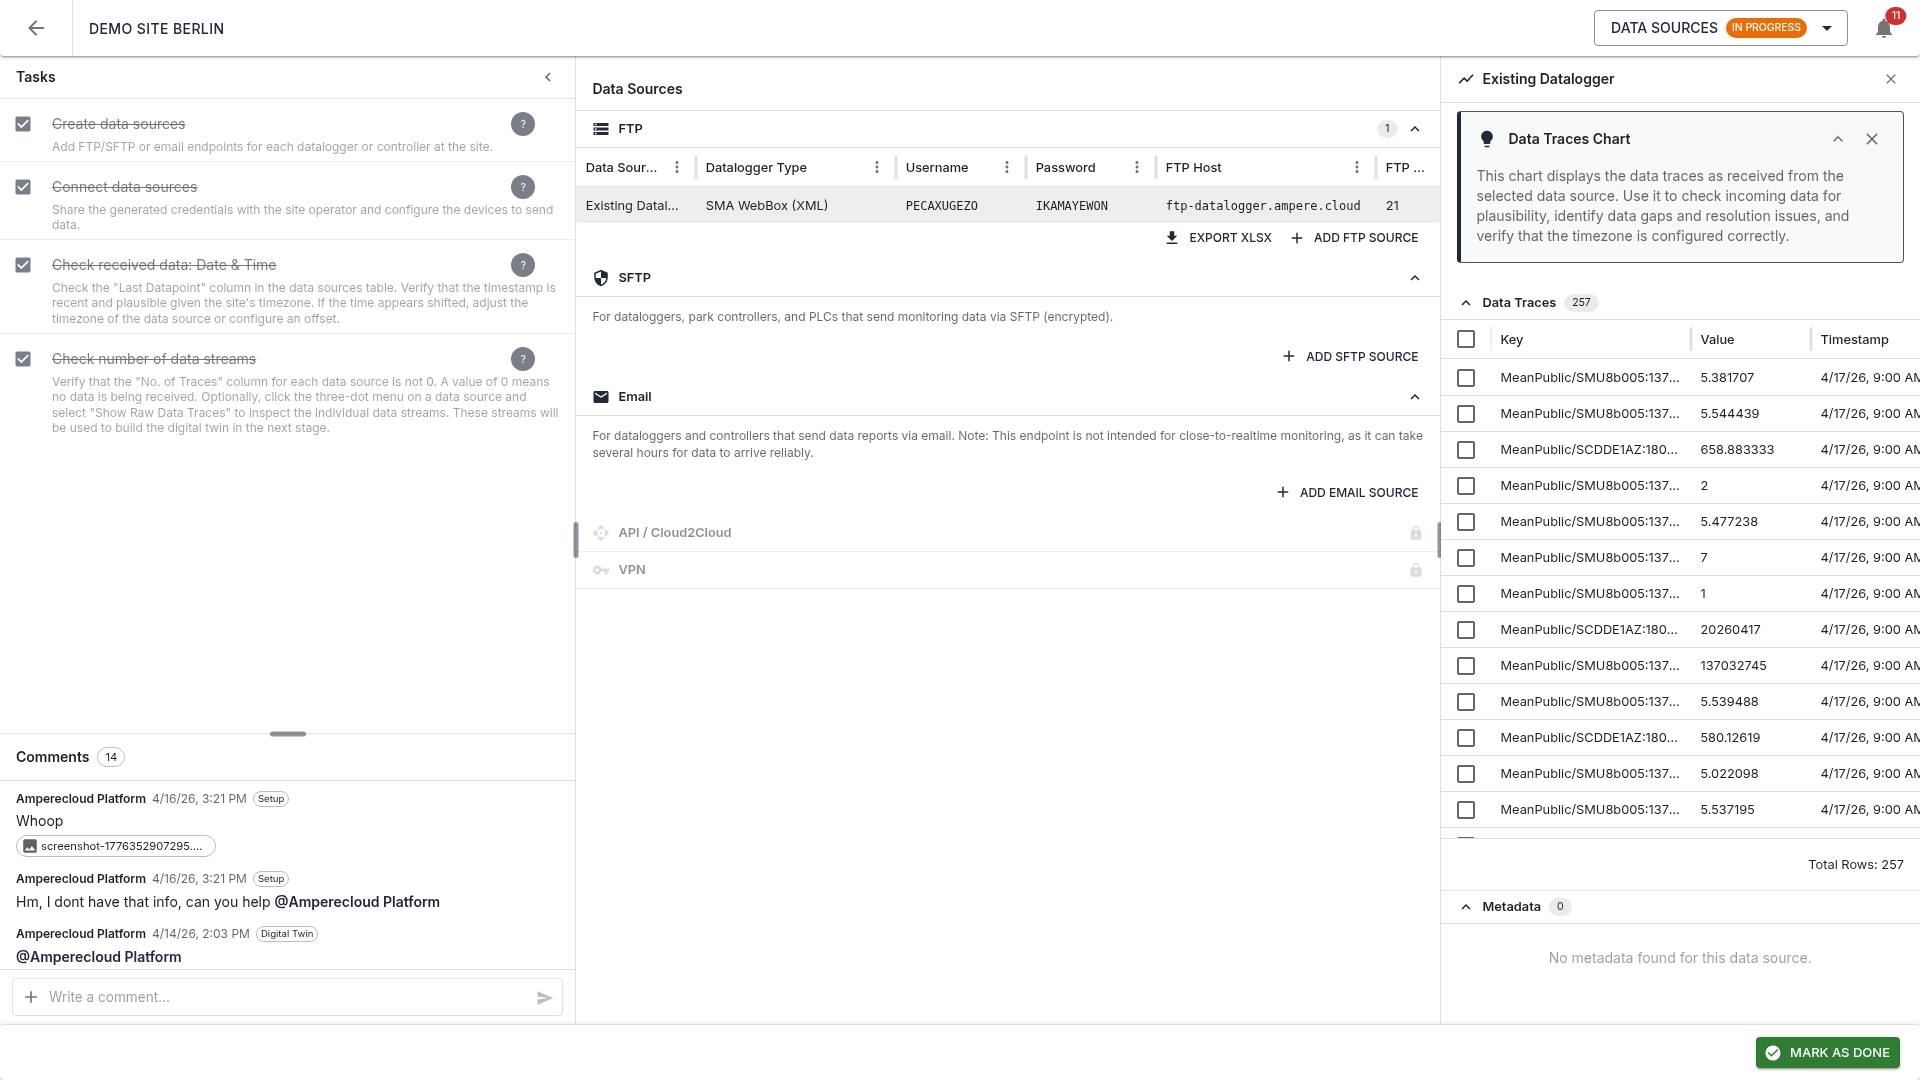
The table shows, per trace:
- Key: technical trace name
(e.g.
MeanPublic/SCDDE1AZ:180170410:Pac) - Value: current reading
- Timestamp: last measurement
Checkboxes on the left select traces to plot in the chart above the table, so values can be checked for plausibility, correct scaling, and gaps.
Tasks
The Data Sources stage has four tasks:
- Create data sources
- Connect data sources: share credentials and configure the devices
- Check received data: date & time: verify timestamps, adjust timezone or offset if needed
- Check trace count: make sure traces are being received (column „Trace count” not 0)
Tasks 3 and 4 are available only after task 2 is done.
Complete the stage
Same as the Setup stage: finish all tasks, then mark as done via the bottom bar. A pre-completion validator checks that at least one data source is receiving traces. Completion requires a digital confirmation and is recorded in the audit log.
Next stage
Scan unlocks next. → 04-Scan